And the devil spoke: "Let there be errors". And God Spoke: "Let there be a debugger". This is a short tutorial to get you started in cornering JavaScript errors. I'll briefly cover
- The magical tool built into every modern browser called the developer tools containing debugger and the console
- How to open this tool
- The very basics
- A special tip when debugging 2sxc stuff
It's targeted at web designers with little experience in JS debugging.
Every Modern Browser has Built-In Developer Tools
This is what they look like
Accessing these Developer Tools
To open these, all you have to do is press F12. It's the same shortcut for Chrome, IE, Firefox, Edge.
What's in this tool?
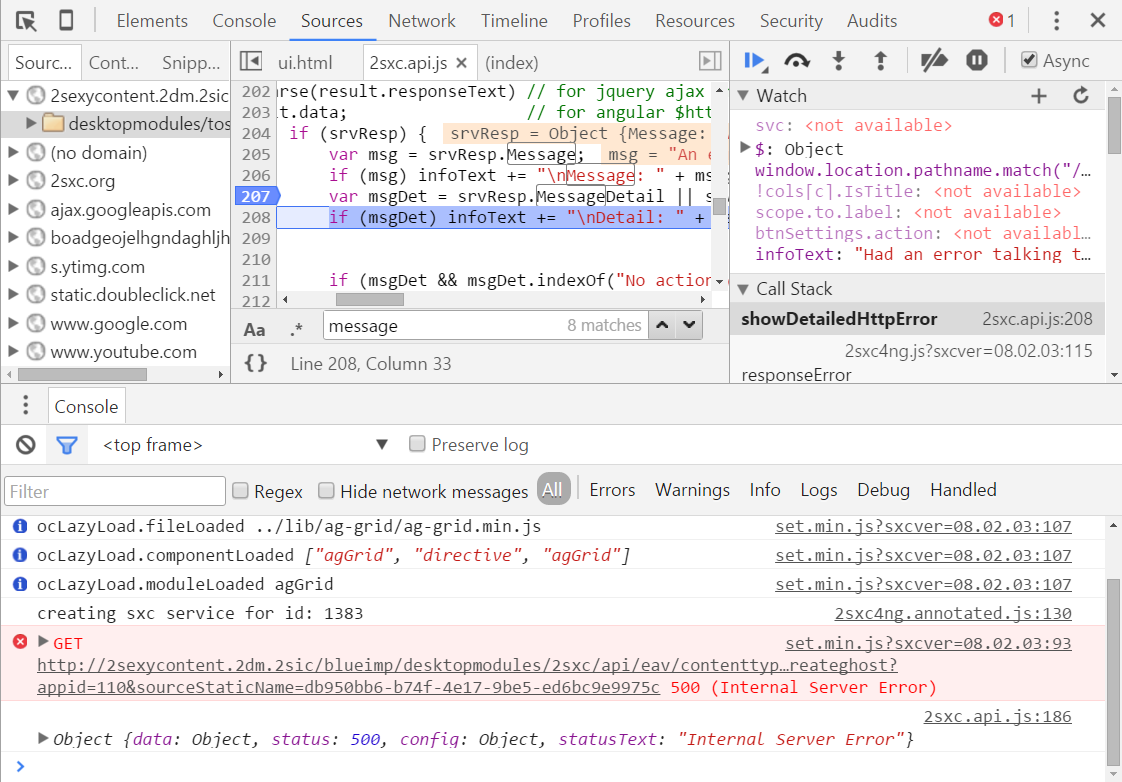
JavaScript Stuff
- Source code view of all the scripts / html parts used in the current page
- A console, which is very, very important...
- Most scripts will output additional information in the console
- You can do things like type in javascript to find out things - like when you type in "window" and hit enter, you'll usually get the window-object to immediatly look inside it
- You can also use it to experiment with single lines of code which you're just working on, like getting regular expressions right
- Watchers and call stacks
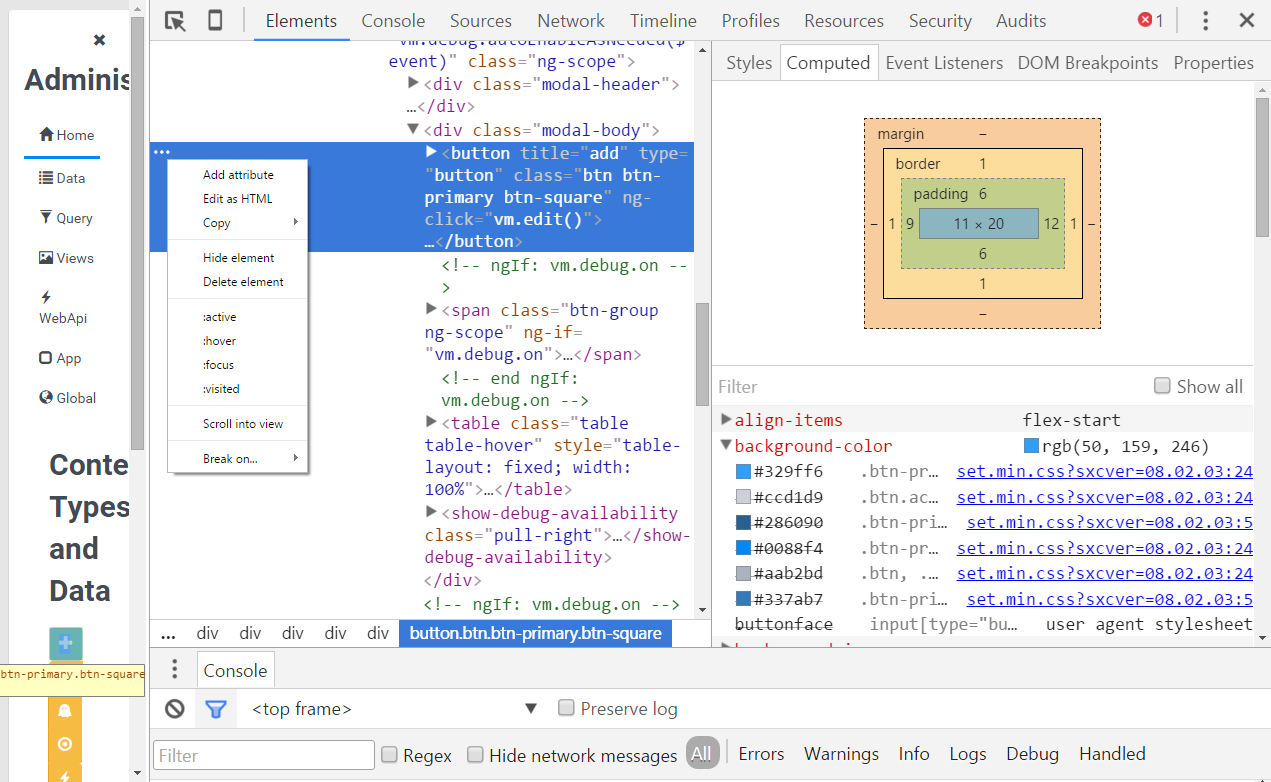
HTML and CSS Stuff
- DOM browsers
- CSS helpers to figure out why something has is exactly where it is and why it looks like that
- You can also change the dom, the styles, disable/enable and way more
Power-Tip when Debugging 2sxc Code and Dialogs
2sxc uses a highly optimized JavaScript which is compressed (also called uglified). This can make it harder to debug, so we included a debug-mode to use uncompressed Javascript. Here's how to activate it:
- on a normal DNN page containing 2sxc code, just add a server-parameter debug=true. Usually it will be something like
http://2sxc.org/en/blog?debug=true
- to debug a 2sxc dialog you should usually open it in a new window (shift + click on the button in the in-page toolbar), then add "&debug=true" to the very long url, and refresh the page.
You can read more about debugging 2sxc in the blog posts about debugging.
So give it a try, you'll be amazed.
Love from Switzerland,
Daniel