Working with minified JavaScript - like when using jQuery or AngularJS in a live environment - is troubling when you want to debug something. So let me introduce you to the JavaScript Source Map. This is Lessons Learned #2 from the development of 2sxc 7.
I'll create some more posts after this to help you fully automate the creation of source-maps using Grunt, npm, Lint etc. - but first let's start with the basics:
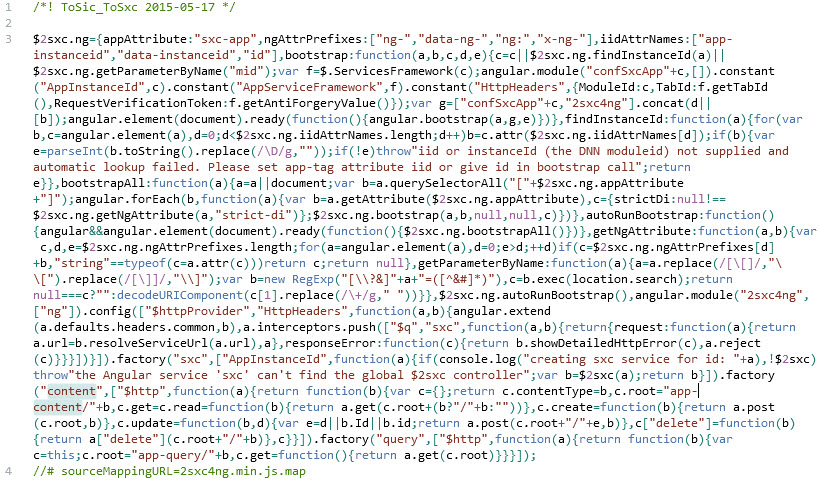
Minified JavaScript is impossible to work with
This is what minified JavaScript looks like - you cannot possibly debug it:
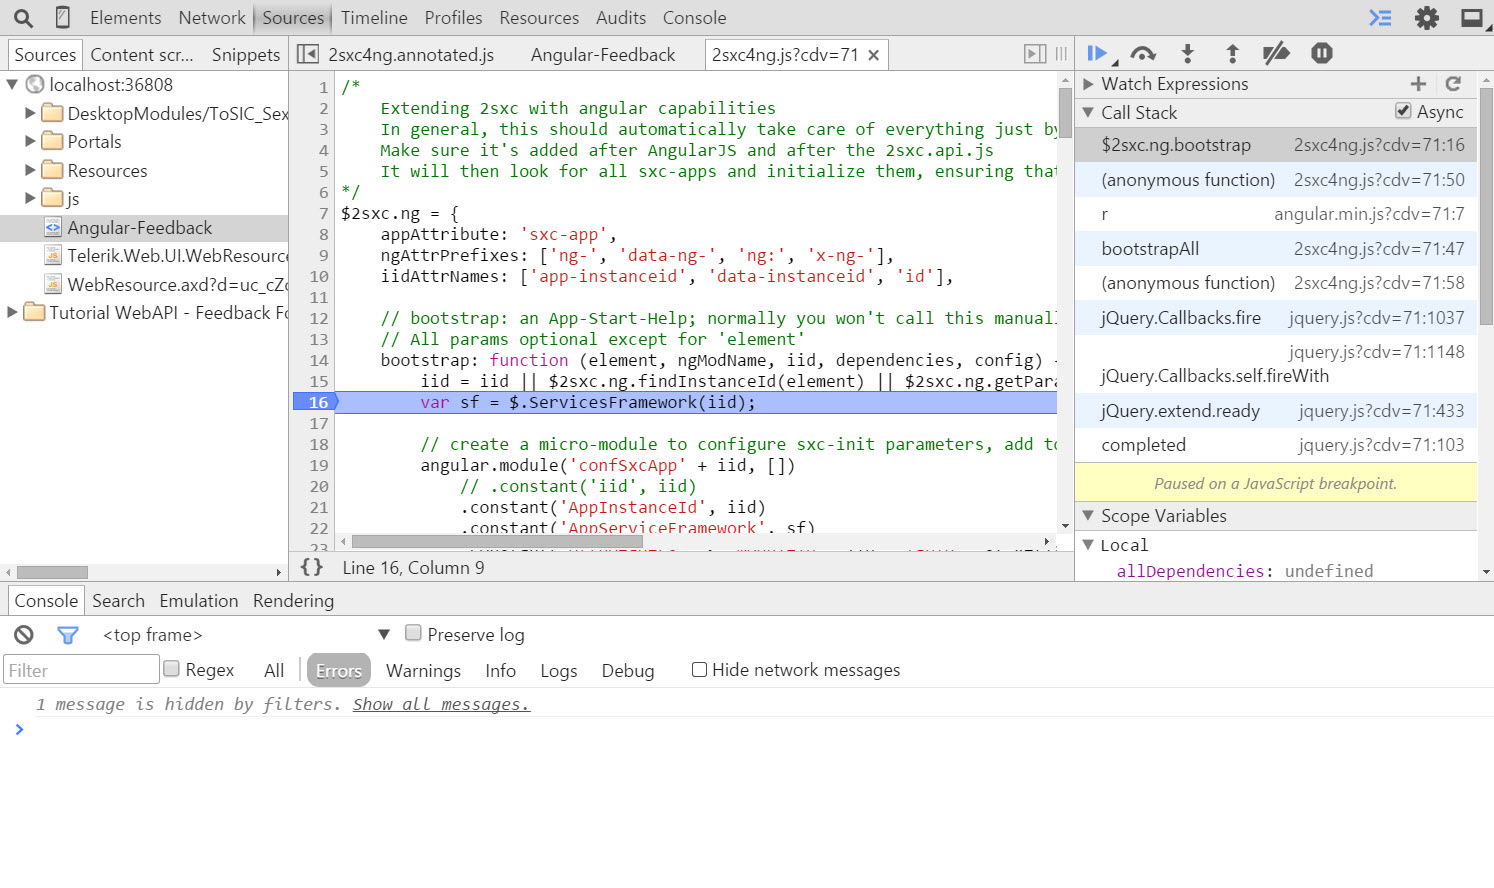
Now in reality - we would like to see this in the debugger:
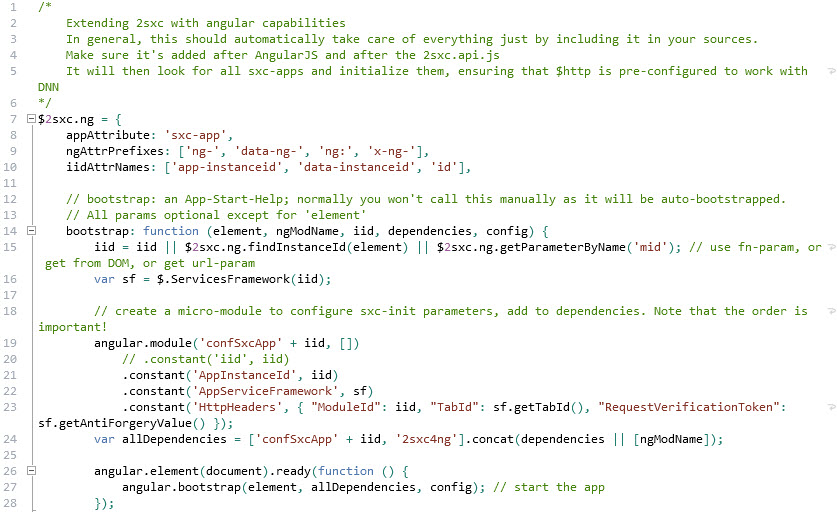
So even though the browser receives a minified file, when debugging we want the real thing.
Enter the JavaScript Source Map
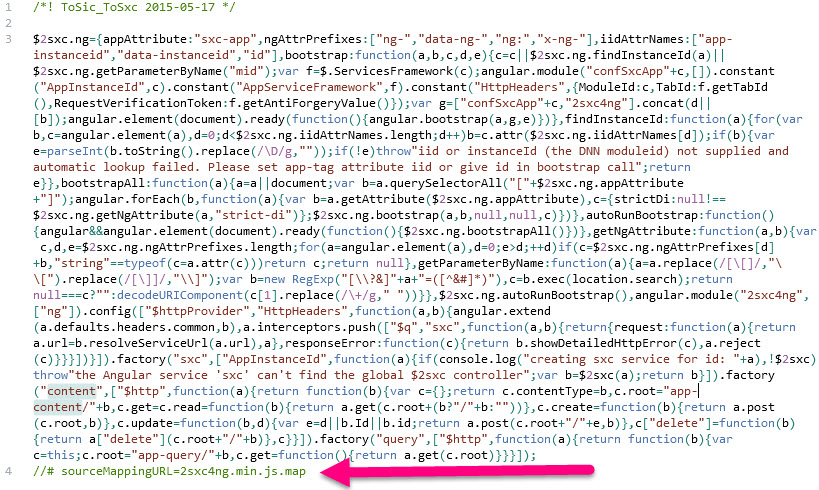
By convention, any minified JS can have a final line telling the browser that there is help material for debugging - like this:
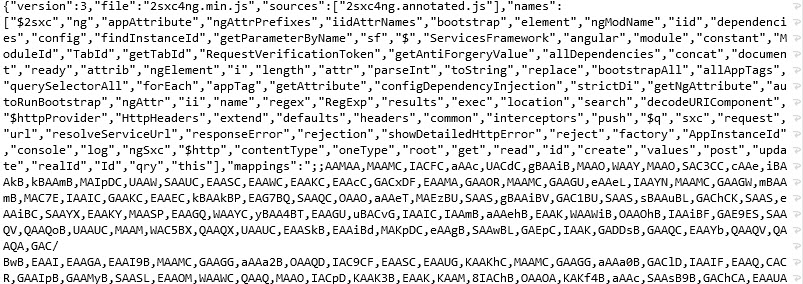
The file it points to looks very chaotic - it's instructions telling the browser how the minified JavaScript relates to the real deal. It looks like this - but you won't be able to reasonably read it:
Thanks to this piece of magic the browser will now show you the original code when debugging. You can even set break-points and everything. This is awesome!
Hope this helps you!
With love from Switzerland,
Daniel