Sometimes you need to see what's going on inside the EAV data-layer or 2sxc. This is now possible, with Extensive Logging. Enjoy.
Extensive Logging Of *Everything*
2sxc 9.6 logs just about everything it does, analyses and more. We wrote around 5'000 lines of code to get this to work, enabling us to look inside 2sxc and the EAV data system, to really see what was going on.
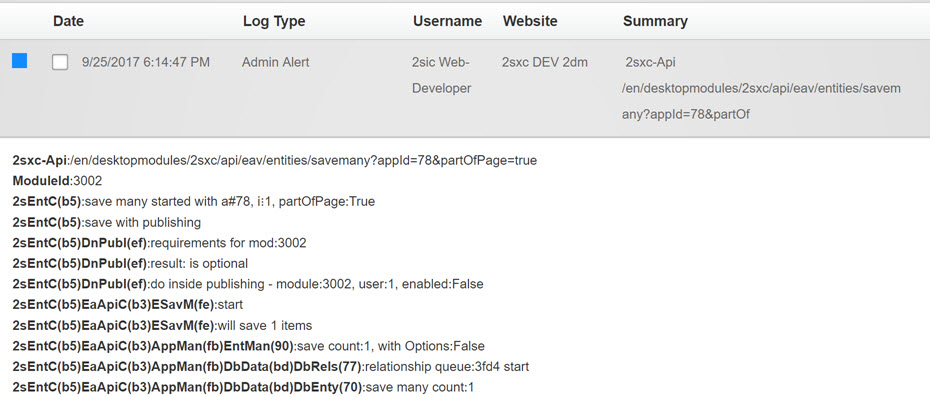
Here's an example log showing a part of a save operation:
This kind of logging is helpful, when something fails or breaks. Nowdays there are thousands of 2sxc installations out there, and it's often hard to see what's going on under the hood, if you can't just attach a visual-studio debugger. This extensive logging provides deep insights into what is going on, and will continue to be enhanced.
Enable / Disable Extensive Logging
Internally 2sxc will always log everything, but it will not publish the result. This is important to keep your pages small and the event-log clean. But when you do need it, here's how to do it.
- open any 2sxc dialog (like the edit-dialog or admin-dialog)
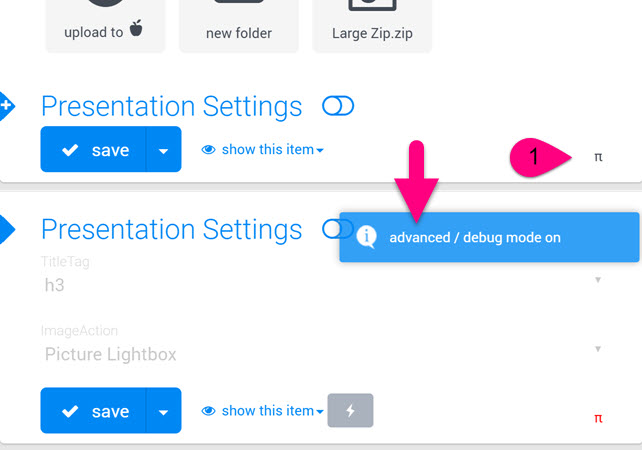
- look out for the π (pi) character in the bottom corner of the dialog - this shows that a dialog offers advanced debug information
- on such a dialog, do a ctrl+click anywhere on the dialog, to enter debug-mode (you can read more about this on this blog about debugging)
- the debug-mode is currently only in the UI, but you'll notice that the pi has turned red
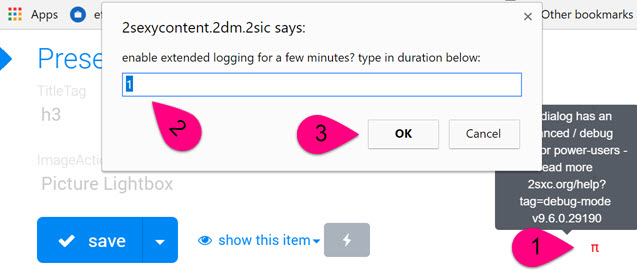
- if you now click on the pi, it will ask you if you want to enable extended debugging, and for how long:
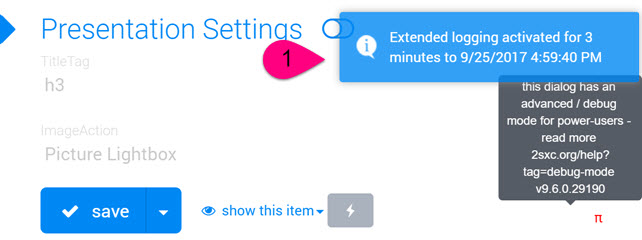
- you will now see a notification that the logging has been activated for the chosen duration:
Note that the maximum duration accepted is 10 minutes. The reason is that extensive logging will quickly fill you event-log, making it a burden. The 10 minute limit protects you from accidentally running extensive logging for a long time.
Using Extensive Logging On API Calls
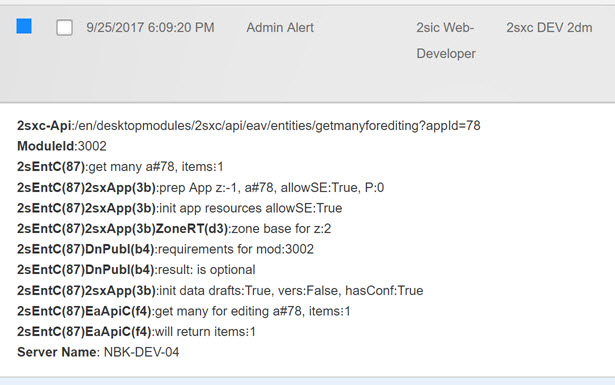
During the time extensive logging is activated, every API call will log what it does. The amount of detail depends on the api-call, as we're still adding more logs as an ongoing process. So if you open the edit-dialog and then look at the DNN event log, you'll see something like this:

When you open a specific event, you'll see a lot of details as to what exactly happened.
Using Extensive Logging on Page Views
Since a website is usually public and will have traffic while you're debugging something, we decided to not put page-debugging into the event-log, but optionally into the page-html. The requirements are:
- you are a host-user OR extensive logging was activated (using the method explained above) and the time has not expired yet
- the page url contains ?debug=true (or /debug/true) as a parameter
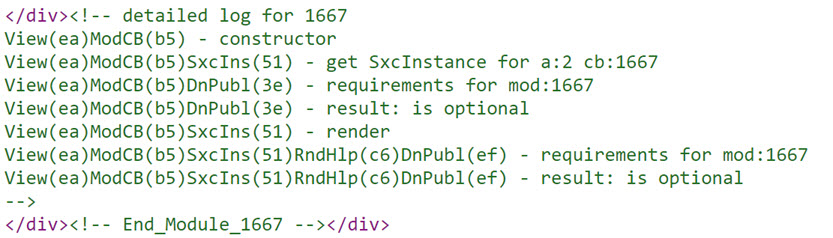
When you do this, the page will output extensive logging as an HTML comment below each 2sxc module (content and app). This will look like this:
Reading Extensive Logs
Note that you don't have to understand everything in these logs, but let's just look at what is being reported. Each line consists of
- path to the component currently reporting something
- message - usually parameters or decisions the code has made
The path is the tree of what-component-called-which-component. It consists of a very short name (2-6 characters) and a random code in brackets. We are using a random code, to differentiate between objects which are re-used, and objects which are re-created (and will have a different random code).
Using Extensive Logging
You may ask yourself how this will help you figure out a problem, so here's an example. Imagine you are using a web-api call to read data, and you're not receiving as many items as you expected. Very often it's because...
- you may be calling the wrong path
- you may have incorrect url parameters (like "authrs" instead of "authors")
- you may think you have 47 items but only see 42, because 5 are not published
- ...and it could be a bug in the software
By looking at the extensive logs, you should see what parameters were processed - helping you confirm the chain of actions, and see what was unexpected. Let's look at this example:
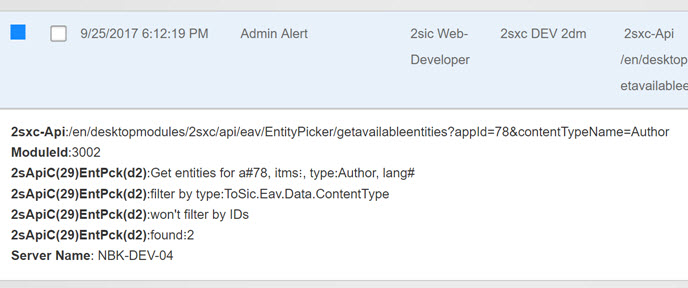
This shows you
- the url which was called
- the url parameters which were used
- what module the api-call thought it was serving
- what app (see a#78) and what type (Author) it tried to receive, and that no language parameter was given
- that it won't apply an ID filter
- how many it found
This lets you match your expectations at every step, and also look at the source-code to see where something went unexpected.
Happy Coding - Note:Beta
Hope you love it - download the latest 2sxc from github, and have fun! Remember that this is a pre-release!
Daniel